You're the operator at Wilder Dam on the Connecticut River. Every morning you decide how much water to release and bid that generation into the day-ahead energy market. Release too little and the reservoir climbs out of its FERC license band. Release too much and it drops out the bottom. Leave the band and you pay a fine, and anything above turbine capacity spills without earning a cent.
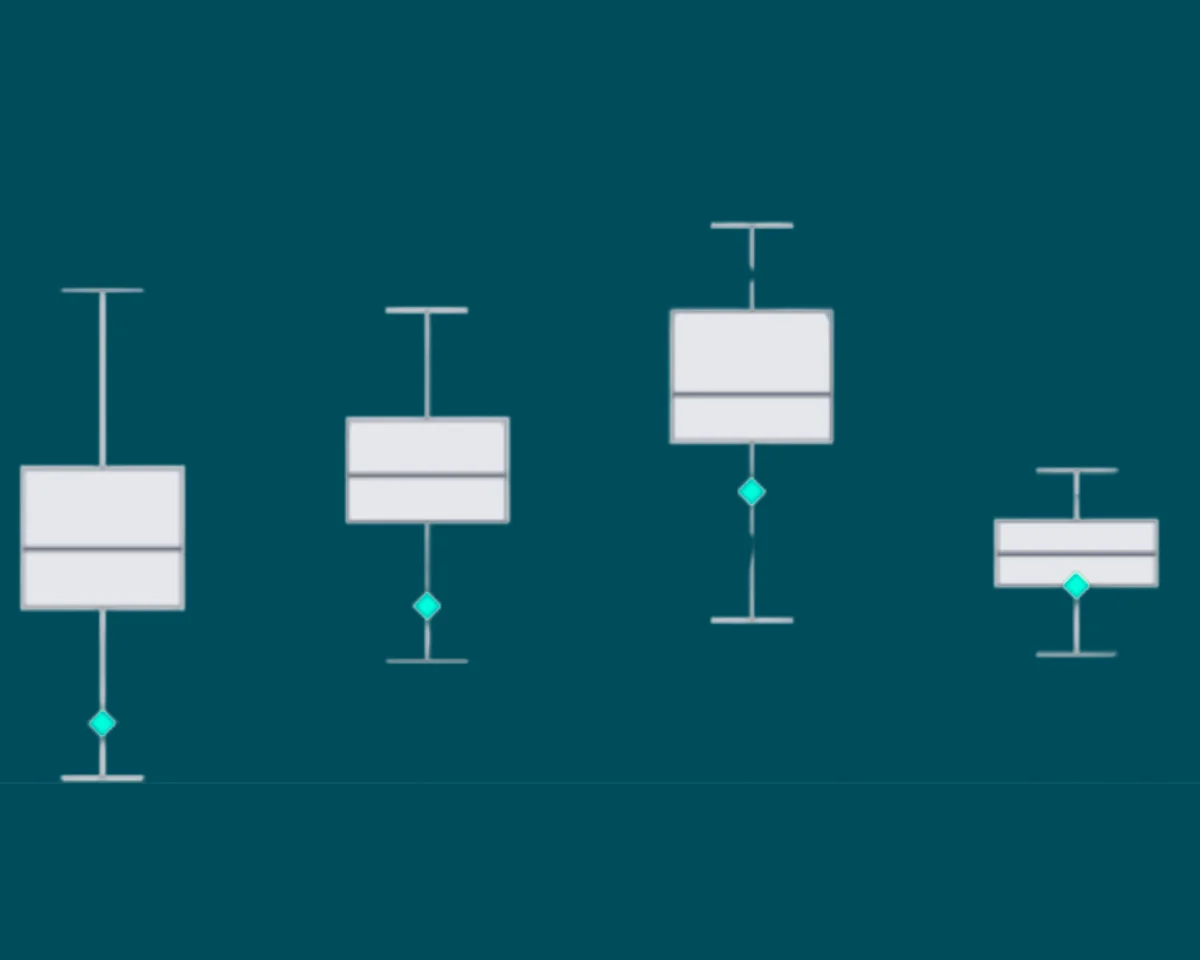
To make the call you have four real day-ahead inflow forecasts from the Pacific Northwest National Laboratory (PNNL) / Great River Hydro evaluation, including HydroForecast. They're labeled Forecast A, B, C, and Persistence, and each one's info button shows where it comes from and how it scored over the full evaluation. Inflows and ISO-NE energy prices are real too, from December 2023.
A guided practice day walks you through the controls. The scored week then takes about three minutes. At the end you'll see your net revenue, how each forecast actually performed, and a link to the full evaluation.
Best played on a laptop or desktop screen.
Want to see what these forecasts could do for your own operations? Book a demo with our team.